Why Testing Matters
Before launching a research study on m-Path, it’s essential to test it thoroughly. m-Path has a ton of features you can enable or disable. Only by testing, you can be sure that everything is correctly set-up. Test as much as you want, this will not cost you any participant slots of your premium subscription.
How to test
1. Install the app on a new phone
Like a participant, newly install the app on a phone. If you want to install the app again on your own phone, you first have to uninstall the old version. Make sure you have written down the recovery code of your old account so you can later recover your old account (for example if you need your old m-Path account for two factor authentication).
2. Choose a nickname
When you open the m-Path app for the first time, choose a new alias or nickname. Avoid the loss of participant slots of your premium subscription by choosing a nickname following these guidelines. Subsequently you can save your new recovery code and accept the terms of conditions.
3. Join your own study
When you have to add a researcher (or practitioner), search for your research using your research name, code or preferably an invitation code. If your research uses an intake, it should immediately be shown after you’ve added the correct researcher/practitioner. If your research uses a baseline auto enroll, you should also start receiving notifications automatically.
4. Complete your own study
Fill in the questionnaires and check if you receive notifications at the correct times, at least for a few days. Check both the content of the questionnaires as the timing of the notifications. Don’t forget to imitate a normal participant once in a while by not immediately filling in the questionnaires and testing if your reminders work.
5. Inspect the gathered data
Export your data. Check if the exported data looks as expected. Do you have all information necessary to answer your research questions? Potentially already try to run your statistical models.
Avoiding the Loss of Paid Participant Slots
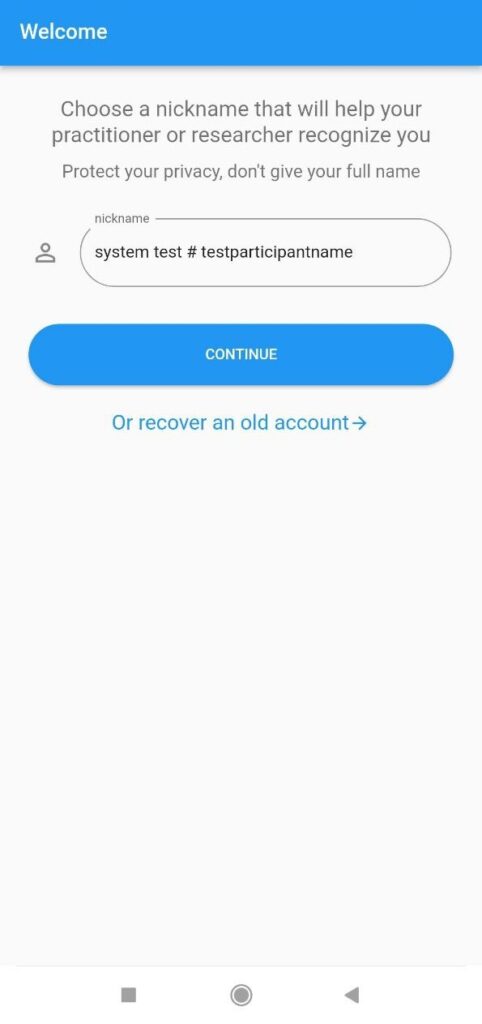
We understand that every participant slot counts, especially when you’ve invested in them using an m-Path premium subscription. To ensure you don’t use up a participant slot that you’ve paid for while testing you can use an alias that begins with the prefix ‘system test #’ when registering the test participant (see for example image below). This will flag the device as a test device.
The system automatically recognizes this prefix and ensures that this “participant” is not counted against your quota.
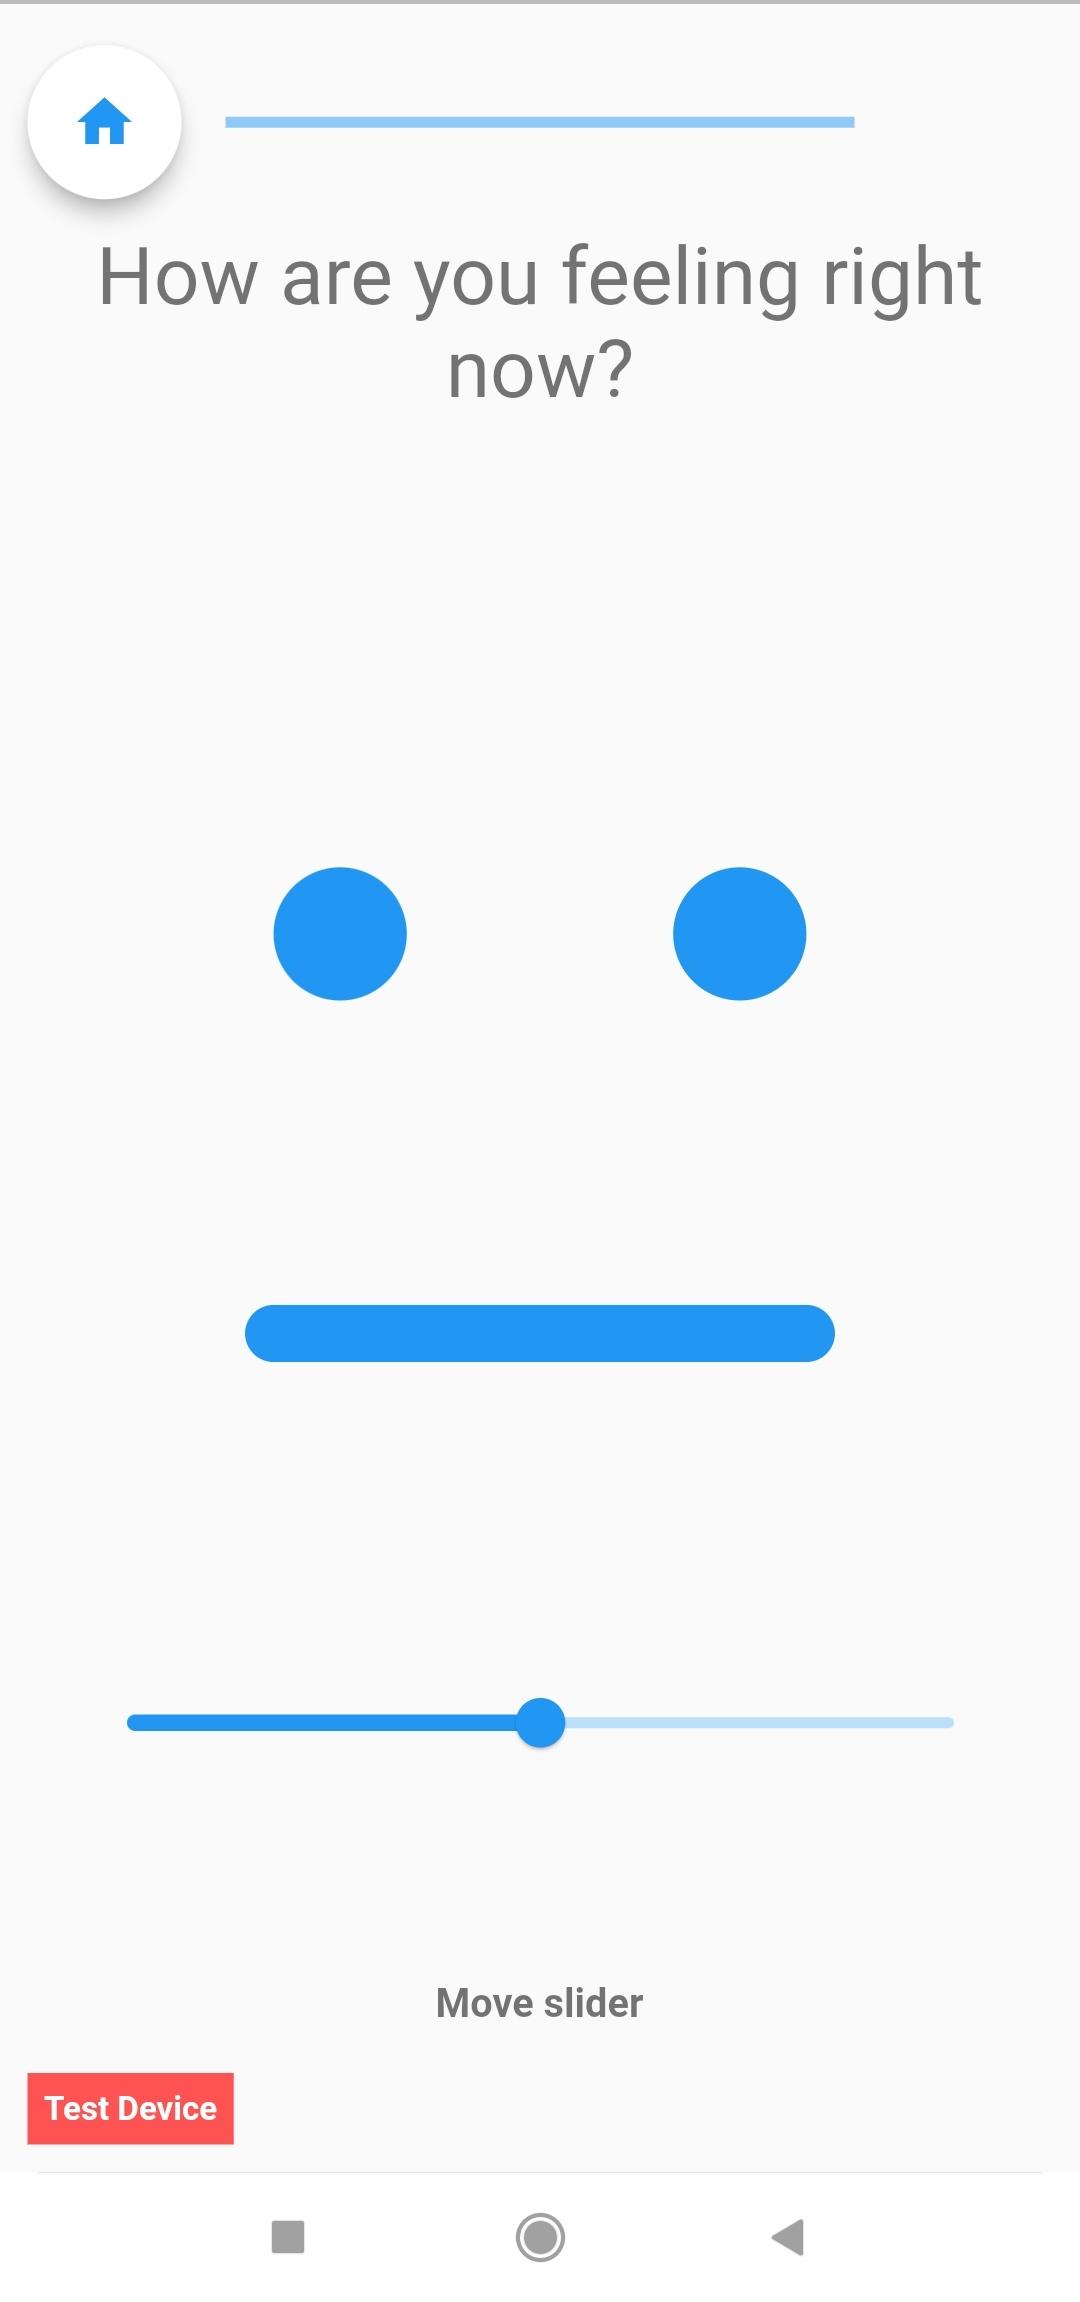
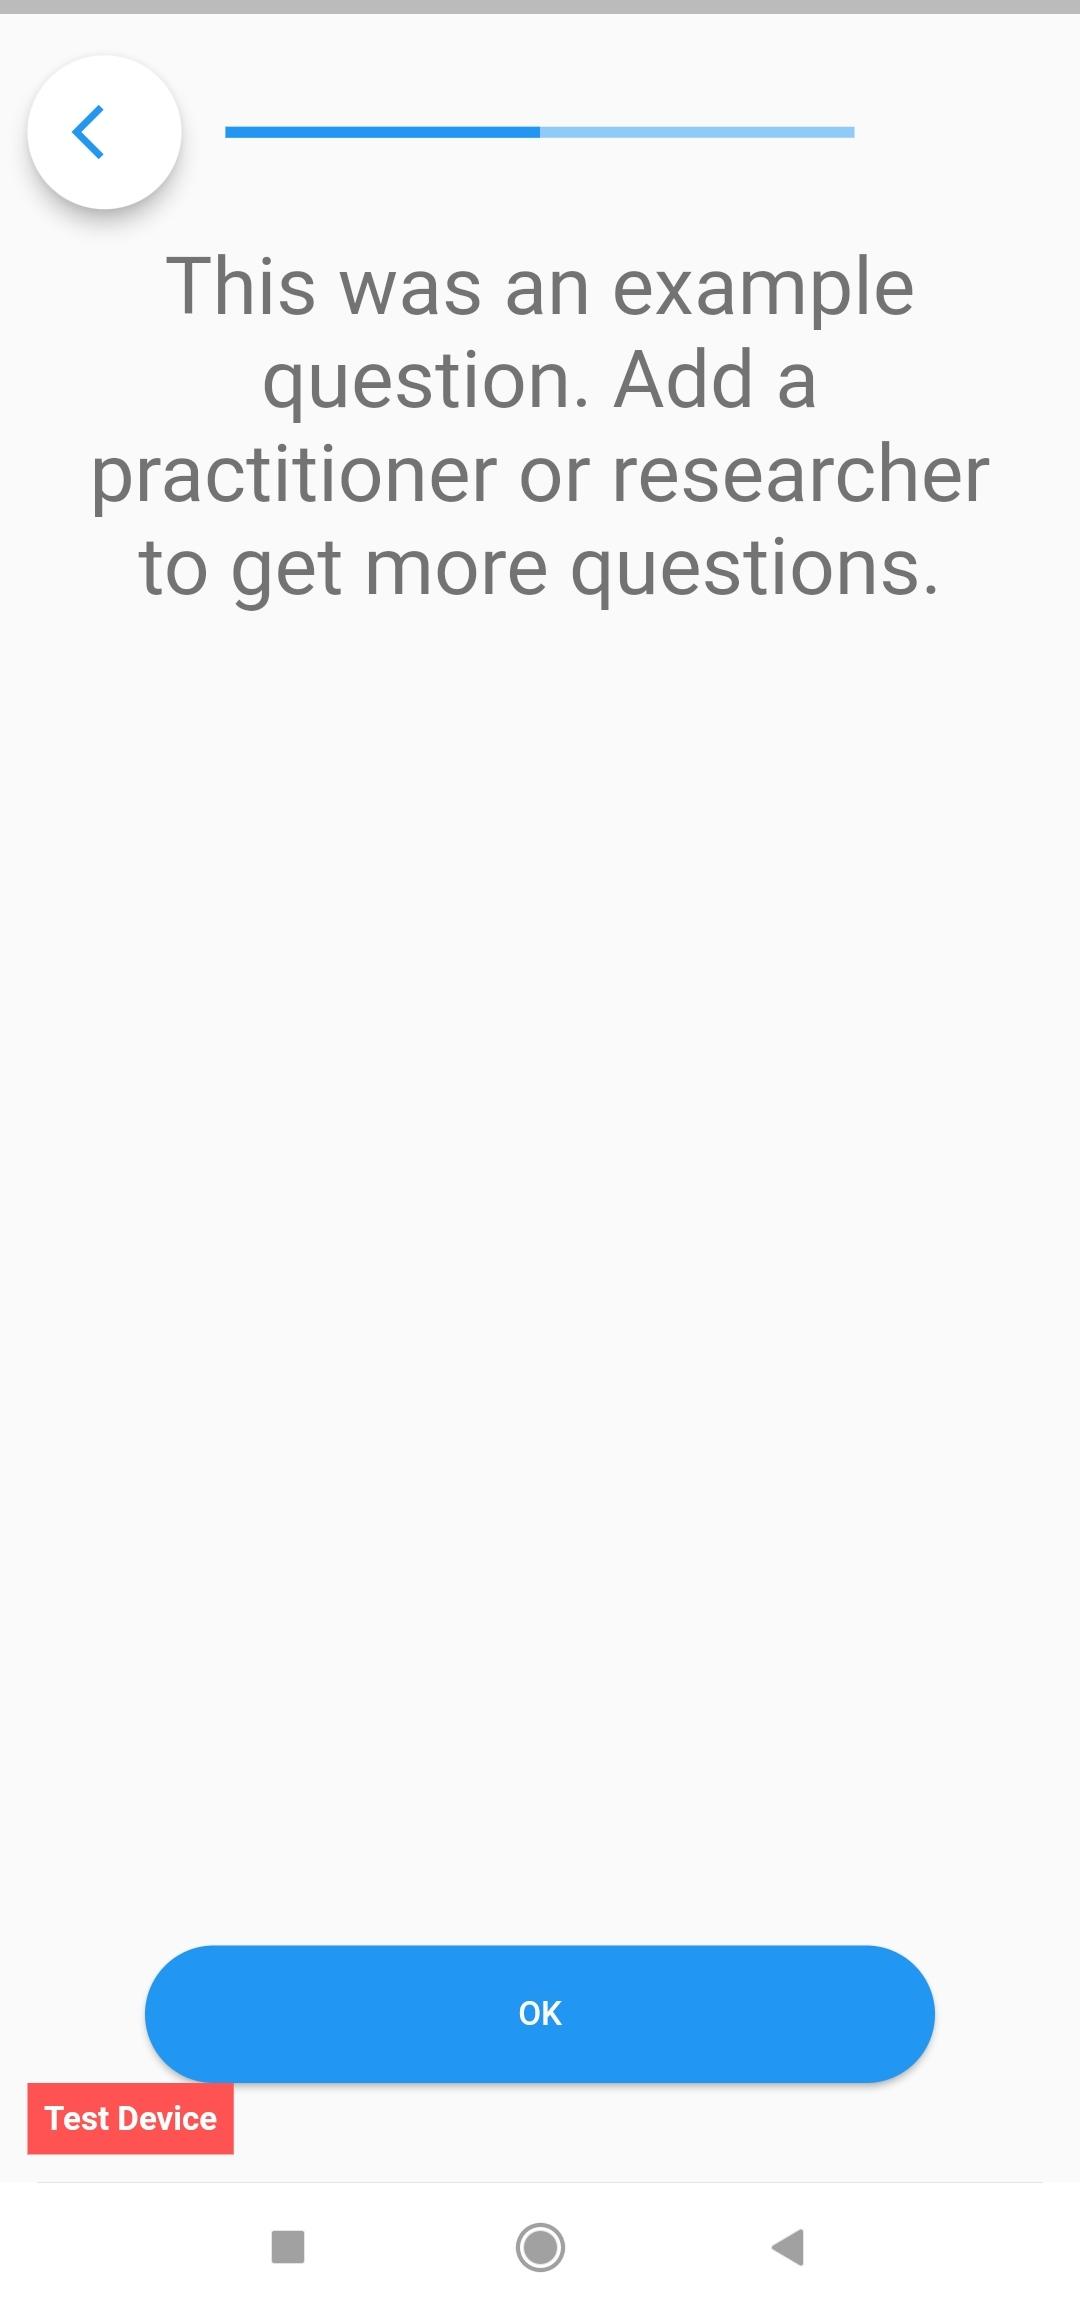
Visual Indications of Test Mode
When a device is in “TEST MODE”, certain visual indicators will appear within the app to signal that the data being collected is for test purposes only.
A Word of Caution
Using the “TEST MODE” is intended solely for testing purposes. This method should not be employed for real research participants. We cannot ensure the integrity of data of participants in “TEST MODE”.
Go into debug mode
In debug mode it is possible to quickly see all current answers in a questionnaire, while you are filling out a questionnaire. This can be really interesting when debugging more complex logic in questionnaires, that for example use computation items (pseudo R).
To go into debug mode you have to
- Open settings in the app (top left button in the home screen of the app)
- Tap on Extra
- Tap on Notes
- Add a note (click on plus icon)
- Type in !start debug! (see image below)
- Tap on add
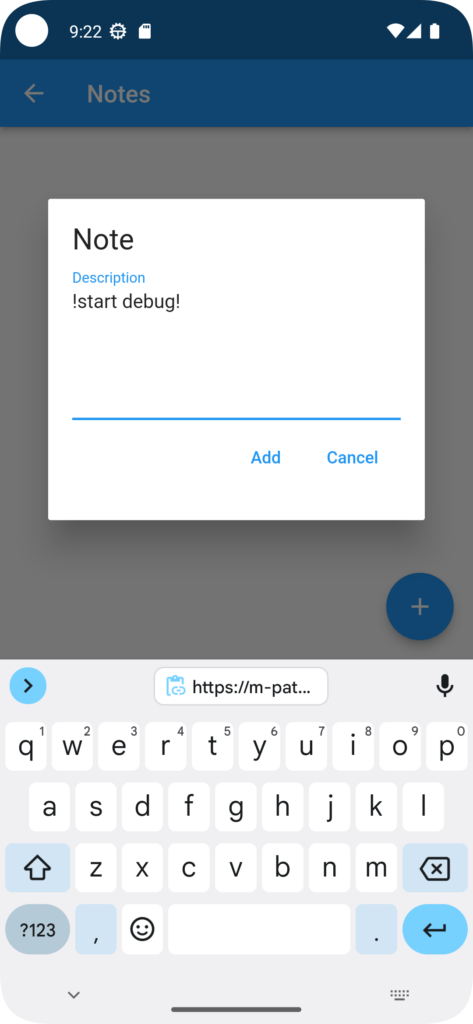
You are now in debug mode.
In debug mode, you will always (unless you are on a question that has a deadline) see a bug on the top right of your screen in a questionnaire. When you click on this bug you will open the debug page.
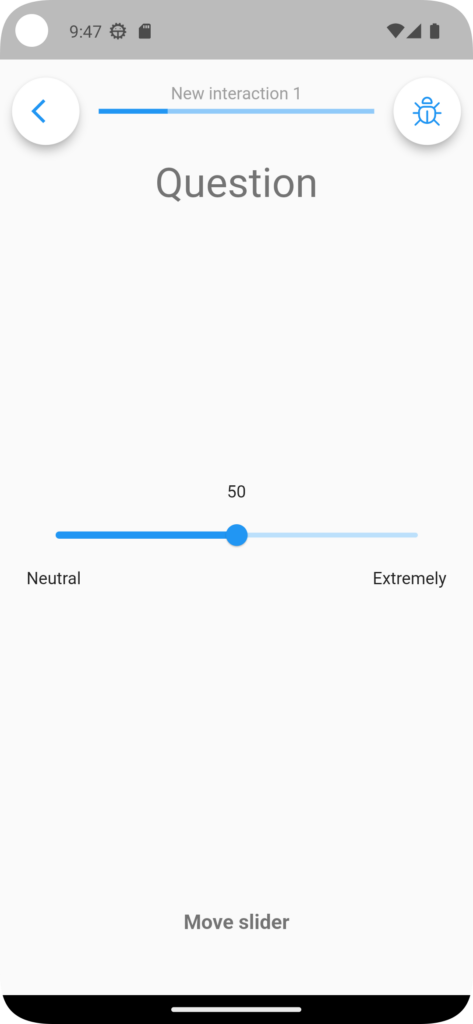
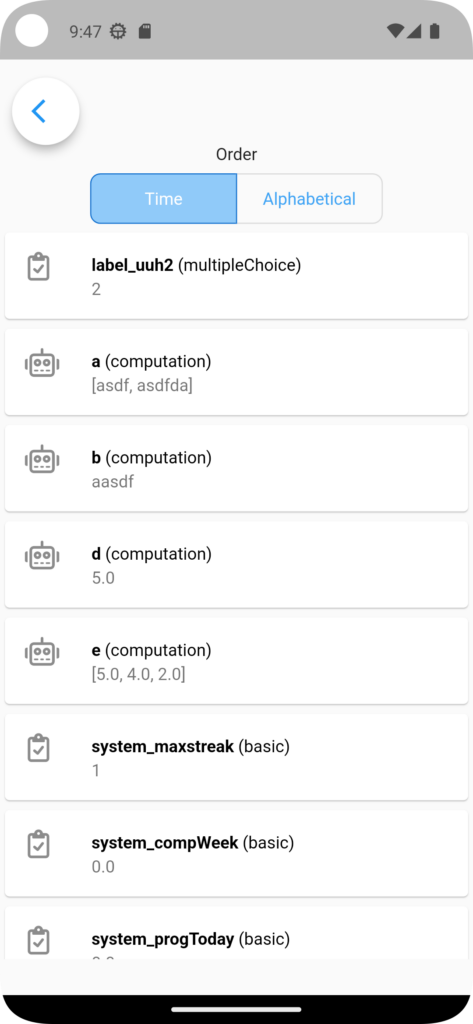
In the debug page you can see all variables recorded in the questionnaire. These variables include
- answers from questions (see label_uuh2 in image below)
- results from computation questions (see a and b below)
- system variables that are automatically loaded (see system_maxtstreak below).
