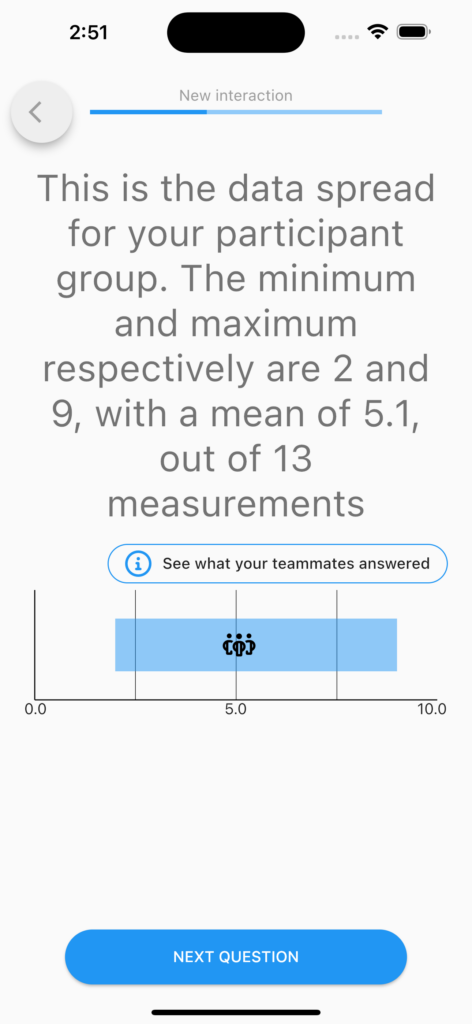
In your m-Path dashboard it is possible to divide clients in groups. This can be useful for several reasons, one of which being that data can be shared within groups. While the Group Statistics item allows you to pipe certain aggregative values to computations or question texts, the Group Summary questionnaire item shows a graphic overview of the aggregated results of a certain group for a single continuous-value question, or for an open question, and allows a user to situate themselves within that group.
Summary Type
Box Plot
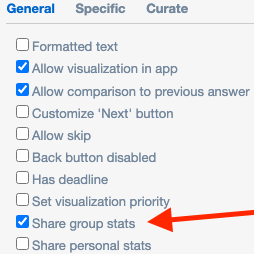
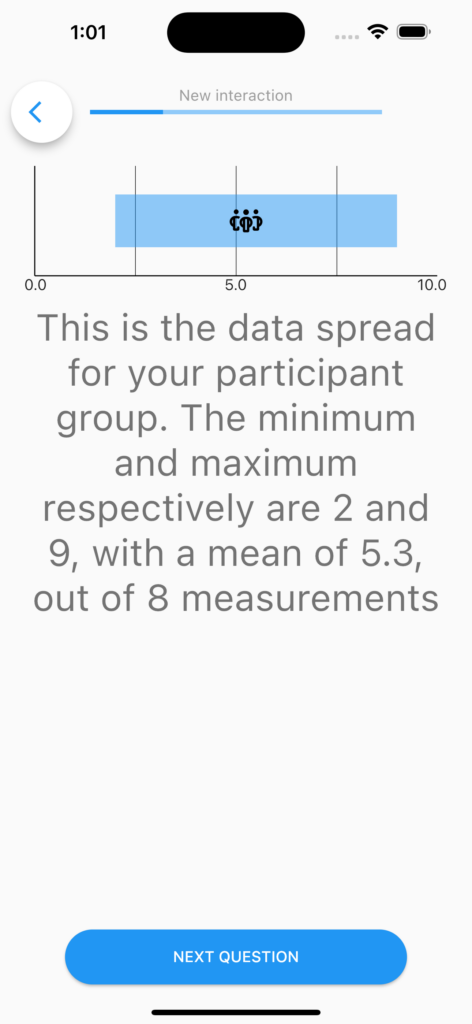
There are two types of summaries. A box plot, which can visualise a numerical value distribution, and a word cloud which shows a cloud containing the most frequent words appearing in an open question. Due to the nature of the box plot summary it only works with continuous-value questions. In the General settings of the question, you will have to check “Share group stats”, so other users can access the group data. If you additionally check “Share personal stats”, it becomes possible for users to identify other group members by their responses.
The text accompanying the summary can include a few variable values. The following insert directives are supported:
@INSERT{[startSysTemp]}
// the minimum value collected

@INSERT{[stopSysTemp]}
// the maximum value collected

@INSERT{[middleSysTemp]}.
// the mean of all collected values

@INSERT{[nSysTemp]}.
// the total amount of values collected

@INSERT{[selfSysTemp]}.
// the average response value of the user themselves
Keep in mind that these values cannot be piped to other questions. If you want to use group values in other questions, see the Group Stats module.
Word Cloud
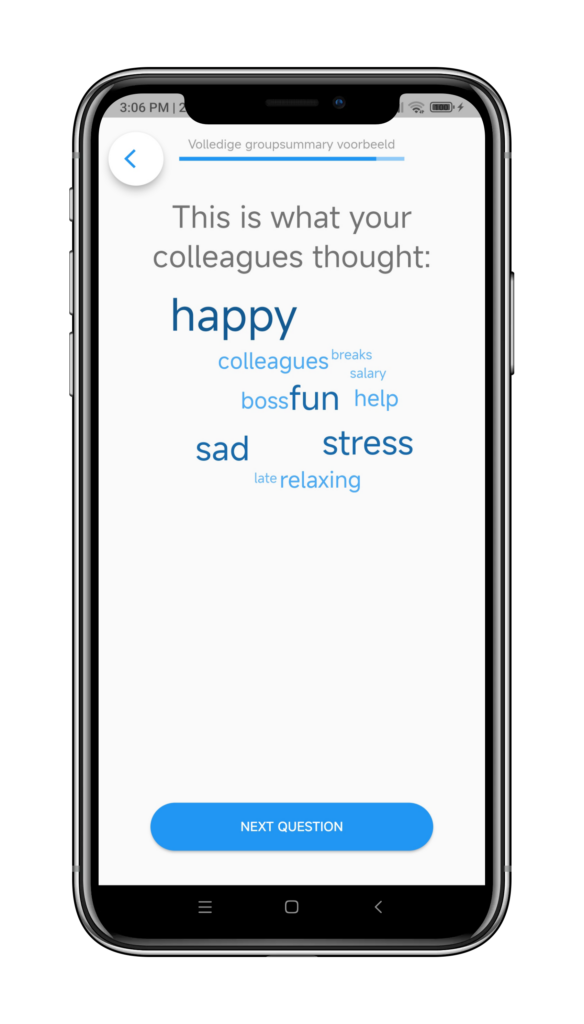
The word cloud visualisation shows a cloud consisting of the most frequent words appearing in answers to an open question. Here, there’s no options for piping, and you have to make sure the share personal stats option is checked.
Label to summarize
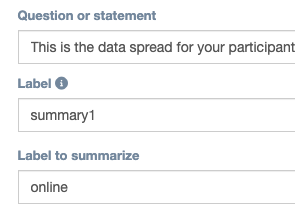
Here you enter the label of the continuous-value question of which you would like to create a summary.
Summary type
General
Specific
Full Population
If you check this box, even if the user is not part of a group, the generated group summary will include results for all users who respond to this questionnaire. If you don’t need to split up your connected users in separate groups, but just want a global summary, use this option.
Relevant interval close-far
If you want the summary to be of a certain timeframe, fill in these boxes. This way, only results filled in within this timeframe will be considered. For compatibility reasons, these timeframes are in seconds. The default, 0-86.400, encompasses the last day.
Minimum-Maximum value for visualization
These values denote what the range for the visualization will be. For optimal results, set these to equal the extreme values of the visualized slider.
Interaction name to look in for recovering last personal answer
In case the last personal answer for this user is located in another interaction (for instance, an intake), you can fill in the name of this interaction here so the module will look inside this interaction for answer data as well. Of course, the question will still have to have the same label as the one we are visualizing.
Show text on top
Normally the text explaining accompanying the summary will be displayed underneath the graph. Tick this box to make the text appear on top.
Only visible if filled in
When this box is ticked, the user will not be able to view the summary unless they fill in the summarized question themselves. On ticking this box a text field will appear, where you can fill in a text message, to be shown to the user if they do not meet this criterium.
Text if not filled in
Here you can customise the warning message displayed in case the user may not view the question due to the “Only visible if filled in” option.
Show individual answers
If the “Share personal stats” box is ticked in the summarized slider question, checking this box makes it so users can be identified by their responses in the group summary by pressing the information button right above the graph.
Show individual answers button text
Here you can customise the text for the button which displays individual answers. In the example above, it says “See what your teammates answered”.
