In your m-Path dashboard it is possible to divide clients in groups. This can be useful for several reasons, one of which being that data can be shared within groups. While the Group Summary item allows you to show a graphical overview of the team’s responses, the Group Stats questionnaire item allows you to assign variables with these group statistics so they can be used for piping or computations.


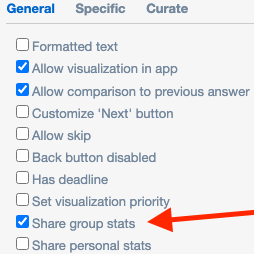
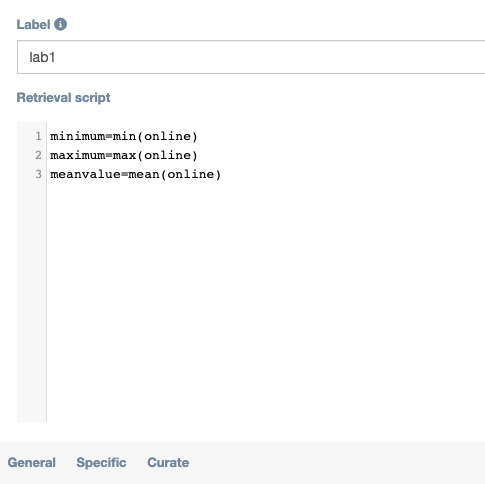
The settings of the Group Statistics module are reminiscent of the Pseudo-R module, but the functionalities are limited. For continuous-value questions where the “Share group stats” box is checked, it is possible to refer to the aggregated group results in Group Stats modules, as shown in the image above. By assigning the results of the three available functions
max(label), min(label), mean(label)to a variable name, these values can be used throughout the questionnaire by way of piping and computation items. NOTE: Do not use above function names as variable names, as this will cause undefined behavior.
General
Specific

Full Population
If you check this box, even if the user is not part of a group, the generated group statistics will include results for all users who respond to this questionnaire. If you don’t need to split up your connected users in separate groups, but just want a global summary, use this option.
Relevant interval close-far
If you want the statistics to be of a certain timeframe, fill in these boxes. This way, only results filled in within this timeframe will be considered. For compatibility reasons, these timeframes are in seconds. The default, 0-86.400, encompasses the last day.
